Analytics store
src/state.jsFilter signals derive active filters, filtered events and aggregate dashboard metrics.
Data starter
A product analytics workspace for examining traffic, funnels and meaningful trends.
Mobile metrics and charts arrive earlier, server reports show their filter snapshot, and cohorts retain a labeled scrollable table. The real bounded report API and all chart ranges passed hosted checks.
This tracks the recorded release phase. The checks below include later findings and ongoing refinements.
The following describes the intended reference. Features are not a verification claim; recorded check results below define what has actually been tested.
Client-rendered workspace with explicit static route entries and a real bounded serverless API; demo data boundaries documented.
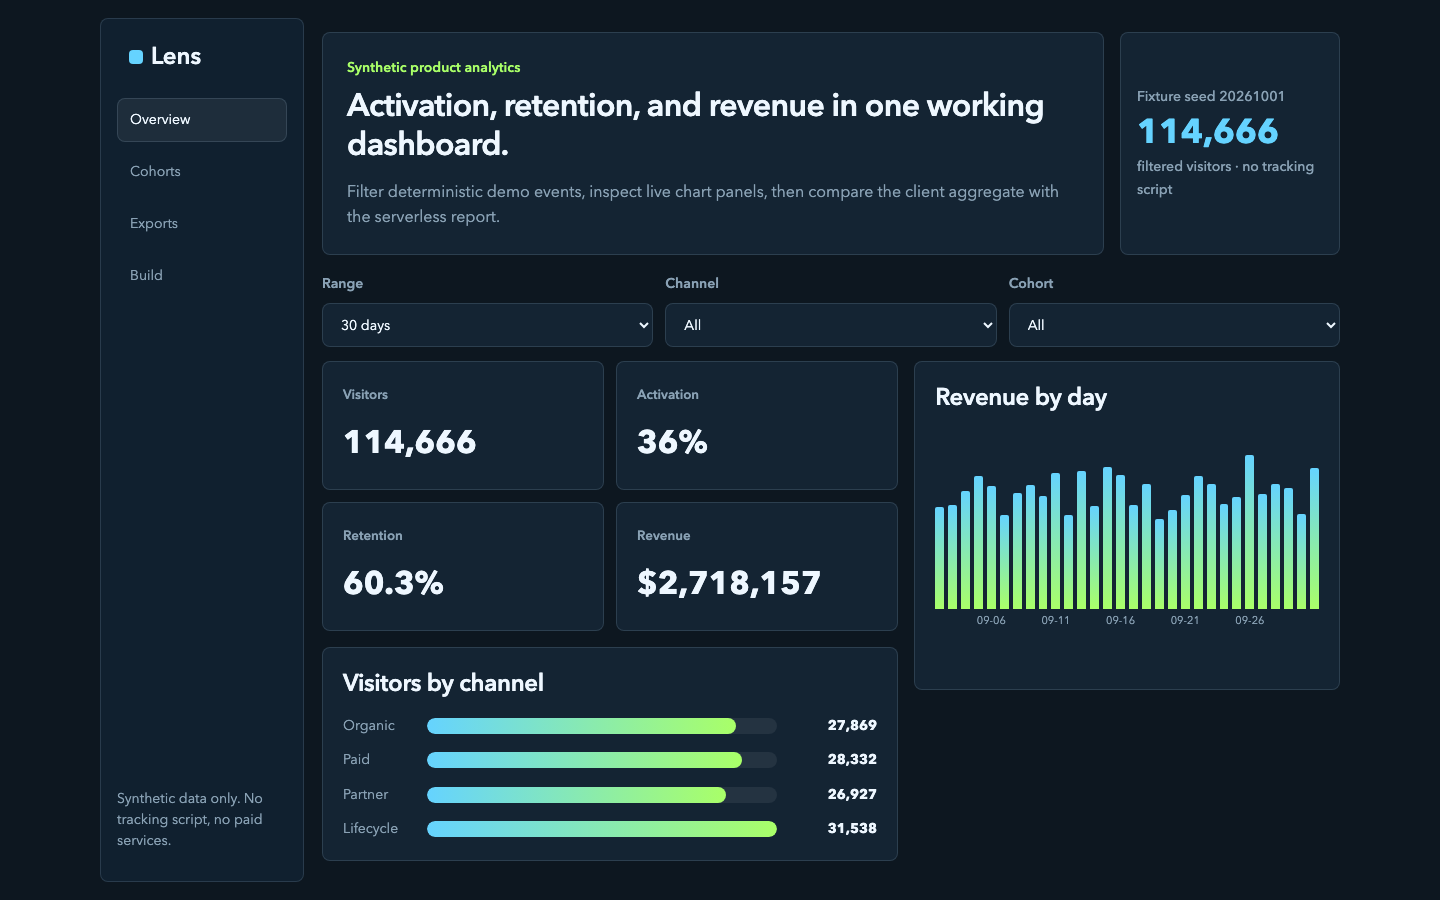
Lens is a client analytics dashboard with a serverless report endpoint, synthetic event data and CSV export.
Analytics store
src/state.jsFilter signals derive active filters, filtered events and aggregate dashboard metrics.
Report API
src/api/report.jsThe function endpoint parses filter input and returns aggregate rows for the current selection.
Bounded JSON reader
src/api/bounded-json.jsThe parser enforces function payload limits before JSON decoding.
Shared analytics domain
src/data.jsFilter normalization, aggregation, chart semantics and CSV serialization use deterministic fixture data.
Responsive application stylesheet
src/styles.cssDashboard panels align to their content rather than stretching beside longer charts.
src/state.js
Dashboard cards, charts, CSV and server reports all follow the same reactive filter shape.
export const activeFilters = computed(() => parseFilters({ range: range(), channel: channel(), cohort: cohort() }));
export const filteredEvents = computed(() => filterEvents(syntheticEvents, activeFilters()));
export const analytics = computed(() => aggregateEvents(filteredEvents()));src/state.js
The function does not receive DOM state. It receives the small normalized contract it can validate and aggregate.
const response = await fetch('/api/report', {
      method: 'POST',
      headers: { 'content-type': 'application/json' },
      body: JSON.stringify(activeFilters())
});src/data.js
Revenue by day becomes a time series, while channel comparisons stay categorical.
export function chartSeries(rows, metric, kind = 'category') {
  const ordered = kind === 'time'
    ? [...rows].sort((a, b) => String(a.label).localeCompare(String(b.label)))
: [...rows];src/state.js
The result remains a snapshot of its returned filters; the UI labels that snapshot and warns when current controls differ.
if (report().status === 'loading') return;Local implementation reported complete. Independent check results and public release evidence have not been recorded here yet.
Actual desktop and mobile screenshots were reviewed after domain-specific layout refinements. Final review cleared the presentation; functional hosting checks remain separate.
Source, README and BUILD guide are published. The Vura deployment is ready; HTTPS home, build guide and genuine unknown404 were checked. Local clean-install and browser workflows are distinct from this hosted route proof.
GitHub CI passed at the recorded source commit: clean install, tests, production build and the configured Chromium browser or smoke workflows. Public README and BUILD files exactly match this checkout.
Fresh HTTPS checks returned200 for home and the in-app build guide, and404 for an unknown path. Source comparison confirms only README or CI configuration changed; the hosted application artifact is unchanged.
Fresh desktop, mobile and product-detail screenshots are captured. Claude Opus5.5 at medium effort is reviewing the rendered evidence and source; this is not a passed design verdict or a new release.
Independent code/spec review cleared the accepted changes; this recorded source workflow passed, the production build completed and the existing Vura project reports ready production. Live screenshots and native workflow evidence are captured separately.
Source ca842dfb5f359246f709f3f7ac6c93804e64f86a is published and its workflow passed. The existing Vura project reports ready production at the recorded deployment. Fresh desktop/mobile/detail screenshots and native workflow proof confirm the accepted refinements; local and hosted checks remain separate evidence.
Compacting mobile analytics hierarchy and clarifying report snapshots and cohort scrolling. Implementation and fresh release verification are pending; this is not a new deployment claim.
Production builds, app regressions and desktop/mobile workflows pass. Independent reviewers cleared the frozen source after async ownership, stale views, storage recovery and guide-width repairs. Current demo/source links still identify the previous verified deployment.
Reviewed source merged after configured CI passed, then built and deployed through the public CLI. Fresh released desktop/mobile captures, actual assets and critical workflows passed; deployment and source identifiers match this record.
Ready production deployment and live response identifiers match the published source checkpoint. Fresh home, product and build routes returned 200 at 1440 by 900 and 390 by 844, with six actual viewport captures, 16px body text, no horizontal page overflow or runtime error overlay. Mobile primary navigation responds and keyboard focus is recorded.
· Live on Vura
Published shared typography and responsive control refinements are tied to the exact live deployment and source revision. Actual released captures replace the previous gallery preview; existing product behavior and source-grounded lessons are retained.
· Live on Vura
Mobile metrics and charts arrive earlier, server reports show their filter snapshot, and cohorts retain a labeled scrollable table. The real bounded report API and all chart ranges passed hosted checks.
· Live on Vura
Unique product identities and deeper workflows are implemented and independently reviewed. Existing releases remain accessible while new source is published and fresh deployments are exercised.
· Live on Vura
Compacting mobile analytics hierarchy and clarifying report snapshots and cohort scrolling. The current source and deployment links still identify the previous verified release.
· Live on Vura
The7/14/30-day revenue chart has a fixed plot/axis layout, aligned baselines and unclipped columns; every date and amount stays accessible. Filters and report workflows remain live.
· Live on Vura
The analytics view uses a vertical revenue time series, aligned cohort comparisons and a quieter brand rail. Shared filters and the report workflow passed live checks.
· Live on Vura
The existing public app remains available while a new design review examines hierarchy, typography, navigation and workflow clarity. Actual findings and before/after repairs will be recorded as they are verified.
· Live on Vura
Public source, green CI and the live app were checked together after the clean-machine documentation pass. Lessons and limitations now reflect the implemented code rather than pending pre-release work.
· Live on Vura
The public source and build reference match the released learning journal, and the source workflow is green. The demo remains live at the same verified deployment; documentation-only refinements did not change application code.
· Live on Vura
The README uses npm ci rather than npm install, so clean-machine setup reproduces the reviewed lockfile before installing Chromium. This documentation-only refinement does not change the hosted app.
· Live on Vura
The public source and build reference match the released learning journal, and the source workflow is green. The demo remains live at the same verified deployment; README and CI-only refinements did not change application code.
· Live on Vura
The README now installs the locked Chromium engine after npm ci and explains the Linux system-library prerequisite. The hosted application is unchanged; code examples, repair notes and boundaries remain source-backed.
· Live on Vura
The reviewed implementation is available from its independent repository and real hosted URL. Detailed code examples and actual repair notes are linked below.
· In review
The local implementation is complete and revised visual evidence has passed review. Source and demo links will appear only after publication and hosted verification.
· In review
The first implementation is available locally. It is not yet a published source reference or a verified Vura deployment.
No release blockers are recorded for this snapshot.
Read the public README and BUILD.md, reproduce the recorded checks and inspect the source before adapting the starter. A live demo, where available, provides separate deployed evidence.